Multiple Choice
Refer to the graph shown. 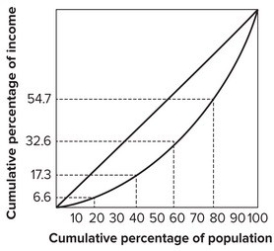 The bottom 20 percent of the families earn:
A) 6.6 percent of the income.
B) 17.3 percent of the income.
C) 10.7 percent of the income.
D) 20 percent of the income.
Correct Answer:

Verified
Correct Answer:
Verified
Related Questions
Q4: For the purpose of determining whether a
Q5: How does the Lorenz curve for the
Q12: What are the distributive consequences of the
Q15: What are the distributive consequences of each
Q26: SNAP provides:<br>A) financial assistance to needy families
Q46: According to the text, the most important
Q51: Poverty is defined by the U.S. government
Q88: The following diagram shows three Lorenz curves
Q89: Refer to the graph shown. <img src="https://d2lvgg3v3hfg70.cloudfront.net/TB7143/.jpg"
Q92: Since the minimum food budget used to