Multiple Choice
Refer to the graph shown. 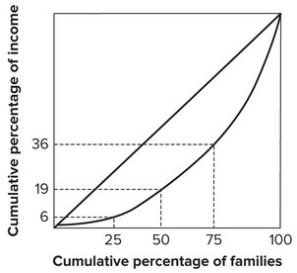 The poorest 50 percent of the families earn:
A) 6 percent of the income.
B) 19 percent of the income.
C) 36 percent of the income.
D) 64 percent of the income.
Correct Answer:

Verified
Correct Answer:
Verified
Related Questions
Q10: U.S. poverty figures do not include in-kind
Q13: An increase in the tax rate can
Q18: On the Lorenz curve, a perfectly equal
Q23: Which of the following Gini coefficients represents
Q23: When measuring income distribution according to class,
Q29: In some countries the tax system is
Q50: Which of the following statements is true?<br>A)
Q63: Which of the following statements is a
Q83: A Gini coefficient of 1 denotes:<br>A) zero
Q128: The graph shows that: <img src="https://d2lvgg3v3hfg70.cloudfront.net/TB7143/.jpg" alt="The