Multiple Choice
Refer to the graph shown. 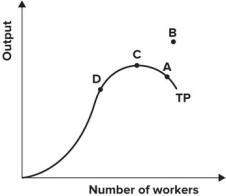 Marginal product is negative at point:
A) A.
B) B.
C) C.
D) D.
Correct Answer:

Verified
Correct Answer:
Verified
Related Questions
Q6: What kind of costs remain the same
Q10: Average variable cost is total variable cost:<br>A)
Q13: The law of diminishing marginal productivity states
Q15: Why does the minimum point of the
Q25: The U shape of the average total
Q60: If marginal cost equals average total cost:<br>A)
Q94: Refer to the table shown. Marginal
Q97: The following graph shows average fixed costs,
Q98: Refer to the graph shown, which shows
Q122: In the short run, average variable cost