Multiple Choice
The following graph shows average fixed costs, average variable costs, average total costs, and marginal costs of production. 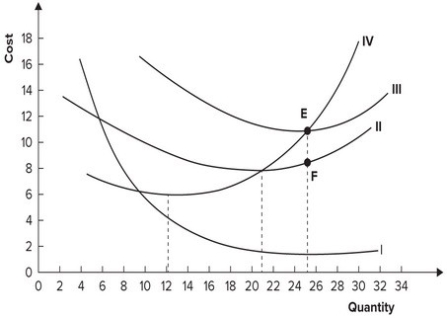 Marginal cost is minimized when output equals:
A) 6 units.
B) 12 units.
C) 21 units.
D) 25 units.
Correct Answer:

Verified
Correct Answer:
Verified
Related Questions
Q10: Average variable cost is total variable cost:<br>A)
Q13: The law of diminishing marginal productivity states
Q15: Why does the minimum point of the
Q25: The U shape of the average total
Q39: Robert withdrew $100,000 from an account that
Q92: The following graph shows average fixed costs,
Q94: Refer to the table shown. Marginal
Q98: Refer to the graph shown, which shows
Q99: Refer to the graph shown. <img src="https://d2lvgg3v3hfg70.cloudfront.net/TB7143/.jpg"
Q122: In the short run, average variable cost