Multiple Choice
The following graph shows average fixed costs, average variable costs, average total costs, and marginal costs of production. 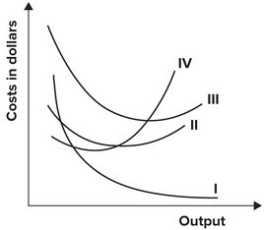 The average total cost curve is represented by which curve?
A) I
B) II
C) III
D) IV
Correct Answer:

Verified
Correct Answer:
Verified
Related Questions
Q28: Refer to the table shown. The
Q29: The diagram was intended to illustrate the
Q33: Draw and correctly label a typical set
Q35: Refer to the graph shown. The line
Q36: Refer to the table shown. The
Q91: If the average cost of producing 10
Q117: Implicit and explicit revenues minus implicit and
Q142: A firm's total variable cost increases from
Q145: A regional airline owns 10 aircraft and
Q157: Can accounting profit be positive while economic