Multiple Choice
Refer to the graph shown. The line segment that represents average fixed costs of producing Q* is: 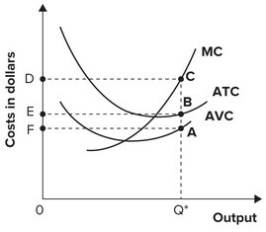
A) AC.
B) CB.
C) AB.
D) cannot be determined.
Correct Answer:

Verified
Correct Answer:
Verified
Related Questions
Q33: The following graph shows average fixed costs,
Q33: Draw and correctly label a typical set
Q36: Refer to the table shown. The
Q40: Refer to the following graph. <img src="https://d2lvgg3v3hfg70.cloudfront.net/TB7143/.jpg"
Q91: If the average cost of producing 10
Q116: Owen runs a delivery business and currently
Q117: Implicit and explicit revenues minus implicit and
Q142: A firm's total variable cost increases from
Q145: A regional airline owns 10 aircraft and
Q157: Can accounting profit be positive while economic