Multiple Choice
The following graph shows average fixed costs, average variable costs, average total costs, and marginal costs of production. 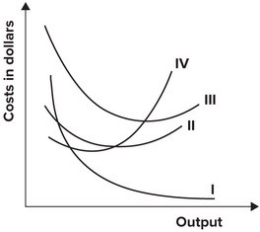 The average variable cost curve is represented by which curve?
A) I
B) II
C) III
D) IV
Correct Answer:

Verified
Correct Answer:
Verified
Related Questions
Q5: (a) Draw a graph of a typical
Q12: Define each of the following cost concepts:
Q13: What are the formulas for the following
Q18: Imagine that you are currently a college
Q42: The marginal cost curve intersects the average
Q69: Refer to the graph shown. Total cost
Q74: Refer to the table shown. Marginal
Q76: Refer to the table shown. If
Q101: The law of diminishing marginal productivity implies
Q130: When labor is the variable input, the