Multiple Choice
Refer to the graph shown. Total cost of producing Q* is represented by: 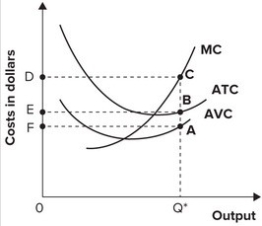
A) area 0Q*AF.
B) area 0Q*BE.
C) area 0Q*CD.
D) cannot be determined.
Correct Answer:

Verified
Correct Answer:
Verified
Related Questions
Q12: Define each of the following cost concepts:
Q13: What are the formulas for the following
Q16: What are the formulas for the following
Q42: The marginal cost curve intersects the average
Q54: A firm is producing 100 units of
Q73: The following graph shows average fixed costs,
Q74: When the average variable cost curve is
Q74: Refer to the table shown. Marginal
Q101: The law of diminishing marginal productivity implies
Q160: The increase in output obtained by hiring