Multiple Choice
The following graph shows average fixed costs, average variable costs, average total costs, and marginal costs of production. 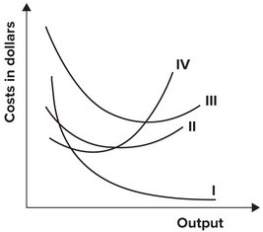 The average fixed cost curve is represented by which curve?
A) I
B) II
C) III
D) IV
Correct Answer:

Verified
Correct Answer:
Verified
Related Questions
Q2: Define a firm and discuss its roles
Q29: Long-run decisions are:<br>A) constrained because all inputs
Q32: How is accounting profit different from economic
Q94: If marginal costs are rising, average total
Q95: Short-run decisions are:<br>A) constrained because all inputs
Q98: Mr. Woodard's cabinet shop is experiencing rapid
Q136: Which of the following is the best
Q184: The following graph shows average fixed costs,
Q186: Refer to the table shown. If
Q191: Refer to the table shown. If