Multiple Choice
The following graph shows average fixed costs, average variable costs, average total costs, and marginal costs of production. 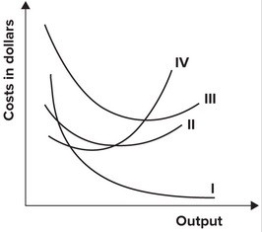 In the graph shown, the marginal cost curve is represented by which curve?
A) I
B) II
C) III
D) IV
Correct Answer:

Verified
Correct Answer:
Verified
Related Questions
Q1: When output is 20, fixed costs are
Q13: The law of diminishing marginal productivity states
Q39: Robert withdrew $100,000 from an account that
Q88: (a)Calculate marginal costs,total costs,average fixed costs,average
Q91: Refer to the table shown. The
Q94: Refer to the table shown. Marginal
Q97: If your cell phone bill is $40
Q97: The following graph shows average fixed costs,
Q113: If marginal cost is less than average
Q122: In the short run, average variable cost