Multiple Choice
Refer to the graph shown. Which of the following wage rates would be an effective price floor? 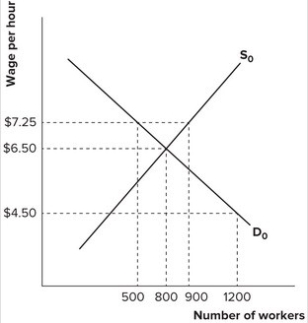
A) $3.50
B) $4.50
C) $6.50
D) $7.25
Correct Answer:

Verified
Correct Answer:
Verified
Related Questions
Q20: Demonstrate graphically and explain verbally the impact
Q27: Refer to the graph shown. Given the
Q29: Refer to the following graph. <img src="https://d2lvgg3v3hfg70.cloudfront.net/TB7143/.jpg"
Q31: Refer to the graph shown. Without government
Q33: Refer to the graph shown. A quantity
Q35: Refer to the table shown that
Q36: A price floor causes excess demand, resulting
Q36: Refer to the graph shown. If government
Q91: If the government imposes an excise tax
Q120: Price ceilings and price floors:<br>A) cause surpluses