Multiple Choice
Refer to the graph shown. A quantity restriction of QR will: 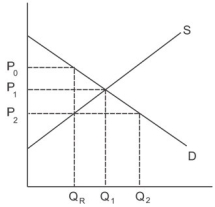
A) reduce quantity supplied to Q2.
B) reduce quantity supplied to QR.
C) have no effect on quantity supplied.
D) create excess demand represented by Q2 − QR.
Correct Answer:

Verified
Correct Answer:
Verified
Q13: How does total size of expenditures in
Q20: Demonstrate graphically and explain verbally the impact
Q29: Refer to the following graph. <img src="https://d2lvgg3v3hfg70.cloudfront.net/TB7143/.jpg"
Q31: Refer to the graph shown. Without government
Q32: Refer to the graph shown. Which of
Q35: Refer to the table shown that
Q36: A price floor causes excess demand, resulting
Q36: Refer to the graph shown. If government
Q91: If the government imposes an excise tax
Q120: Price ceilings and price floors:<br>A) cause surpluses