Multiple Choice
Refer to the following graph. 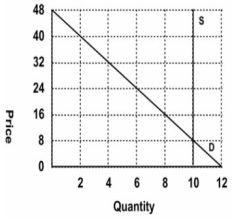 Which of the following pairs of equations describes the supply and demand curves?
A) Qs = 10; Qd = 12 − 0.25P, respectively
B) Qs = 10; Qd = 48 − 2P, respectively
C) Qs = P; Qd = 0.25P + 22, respectively
D) Cannot be determined
Correct Answer:

Verified
Correct Answer:
Verified
Q17: Demonstrate graphically and explain verbally the impact
Q24: Americans over the age of 65 are
Q55: Suppose that there is a renewed interest
Q69: Rent control makes apartments:<br>A) hard to find.<br>B)
Q76: The U.S. Postal Service printed 150,000 sheets
Q109: Suppose that the market labor supply and
Q133: Which price ceiling will cause the greatest
Q153: Refer to the following graphs. <img src="https://d2lvgg3v3hfg70.cloudfront.net/TB7143/.jpg"
Q159: Which of the following pairs of
Q160: Refer to the graph shown. If government