Multiple Choice
(Figure: Education and Earnings) The hypothetical graph shows the relationship between years of education and salary. Which statement is NOT correct? 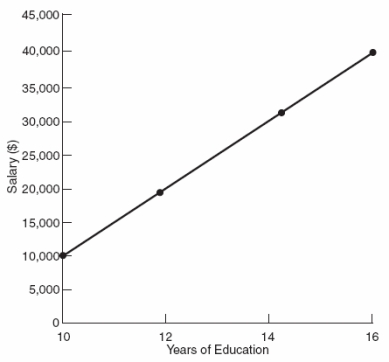
A) A person with 13 years of education can expect to earn $25,000.
B) The slope of the line is 5,000.
C) The line represents a simple model of the relationship between education and earnings.
D) The relationship between the two variables is nonlinear.
Correct Answer:

Verified
Correct Answer:
Verified
Q67: Which statement is a key idea in
Q72: Consider the equation Y = e +
Q111: Economists use graphs because<br>A) they represent relationships
Q149: Markets tend to be efficient because<br>A) people
Q230: The observation that highly productive countries have
Q269: (Figure: Weight Loss and Exercise Time) According
Q270: Which question would be considered a normative
Q274: Allocative efficiency occurs when<br>A) production is allocated
Q277: (Table) Using the information in the
Q293: There would be no economic problems in