True/False
(Figure: Graph Interpretation) In the graph, a negative relationship is depicted with a slope of -0.4. 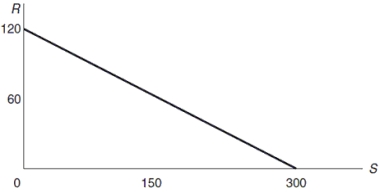
Correct Answer:

Verified
Correct Answer:
Verified
Related Questions
Q37: Joan is trying to gather information on
Q50: (Figure: Sales and Advertising) The graph shows
Q52: When government policies are being designed:<br>A) there
Q53: Scarcity is not a problem faced by
Q57: The broad scope of economic analysis allows
Q58: Our wants are always greater than our
Q59: Reasons to study economics include all of
Q60: A store sells candy bars for $0.89
Q227: The purpose of invoking ceteris paribus is
Q232: If a graph between hot chocolate sales