Not Answered
Each graph below shows the phenotype produced by three different genotypes in different environmental conditions (each line is a genotype). For each graph write "plasticity" or "no plasticity" depending on whether the graph depicts phenotypic plasticity. Also, write "G × E" or "no G × E" depending on whether the graph depicts a genotype by environment interaction. 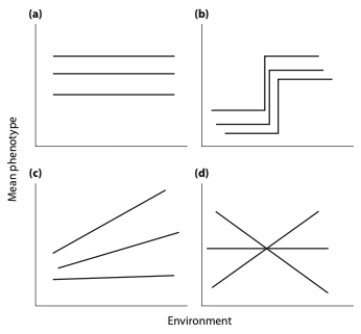
Correct Answer:

Verified
Correct Answer:
Verified
Q28: Scientists studying a species of fish using
Q29: Each graph below depicts reaction norms for
Q30: If V<sub>G×E</sub> > 0,<br>A) there is genetic
Q31: If A<sub>1</sub> represents an allele at
Q32: The total variance in a phenotypic trait
Q34: You are studying the effect of directional
Q35: If the heritability of a trait in
Q36: The residues ("tailings") of mines often contain
Q37: The selection differential for a quantitative trait
Q38: The heritability of a trait describes<br>A) the