Not Answered
Each graph below depicts reaction norms for three different genotypes reared in different environments. In which case(s) is/are there a capacity for phenotypic plasticity to further evolve (you can assume that graphs for parents and their offspring would be the same)? Explain your answer. 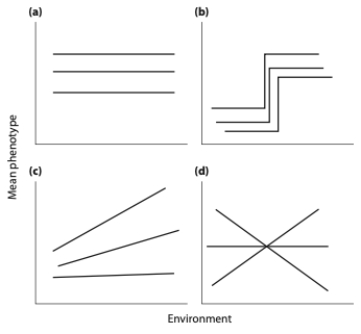
Correct Answer:

Verified
Correct Answer:
Verified
Q24: As a result of warming climate, most
Q25: Which of the following scenarios best describes
Q26: What does V<sub>G×E</sub> represent?<br>A) the genetic variance
Q27: The greyhound is a dog breed known
Q28: Scientists studying a species of fish using
Q30: If V<sub>G×E</sub> > 0,<br>A) there is genetic
Q31: If A<sub>1</sub> represents an allele at
Q32: The total variance in a phenotypic trait
Q33: Each graph below shows the phenotype produced
Q34: You are studying the effect of directional