Multiple Choice
The RC and More Superstore decides to track customer complaints as part of their ongoing customer satisfaction improvement program. After collecting data for two months, their check sheet appears as follows: 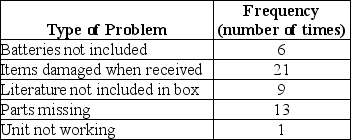 If they construct a Pareto chart, what is the cumulative percentage of the two left most bars?
A) 20%
B) 28%
C) 54%
D) 68%
E) 80%
Correct Answer:

Verified
Correct Answer:
Verified
Q5: A scatter diagram is a graphical representation
Q6: Calculate the number of classes if there
Q7: Define a scatter diagram and describe the
Q8: An affinity diagram creates a hierarchy of
Q9: The activity network diagram is also known
Q11: The "P" in the acronym SIPOC stands
Q12: The _ is used to move to
Q13: The _ is also known as a
Q14: The Pareto chart is one of the
Q15: Control charts are used to determine whether