Multiple Choice
The graph presented below represents the post-test FER data, but what is its correct title? 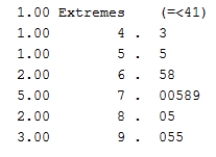
A) Stem-and-leaf plot
B) Histogram
C) Line plot
D) Error bar plot
Correct Answer:

Verified
Correct Answer:
Verified
Related Questions
Q1: A histogram is most closely related to
Q7: Plot the FEV<sub>1</sub> data presented in Q11
Q9: Calculate the mean and standard deviation of
Q9: Analyse the following box-whisker plot. What assumptions
Q11: Why is it necessary to present numerical
Q11: Researchers were interested in finding out how
Q14: Which of the following are important components
Q15: The interquartile range represents how many percentiles?<br>A)
Q17: If you were to graphically present the
Q21: Which axis is the independent variable usually