menu-iconExamlexExamLexServices

Discover

Ask a Question
  1. All Topics
  2. Topic
    Statistics
  3. Study Set
    Discovering Statistics
  4. Exam
    Exam 13: Glm 2: Comparing Means Adjusted for Other Predictors Analysis of Covariance
  5. Question
    Analyse the Following Illustration
Solved

Analyse the Following Illustration

Question 15

Question 15

Multiple Choice

Analyse the following illustration. Which scenario is referable when trying to explain the impact a covariate has on an outcome variable? Analyse the following illustration. Which scenario is referable when trying to explain the impact a covariate has on an outcome variable?   A)  A B)  B C)  C D)  None of the scenarios are appropriate.
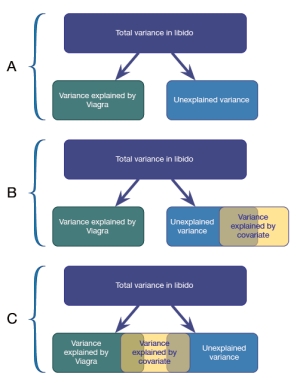

A) A
B) B
C) C
D) None of the scenarios are appropriate.

Correct Answer:

verifed

Verified

Unlock this answer now
Get Access to more Verified Answers free of charge

Related Questions

Q6: How is eta squared calculated?<br>A) SS<sub>M</sub> /

Q7: If you were to analyse the effect

Q11: How would you express the results of

Q12: When conducting an ANCOVA, which would be

Q13: Analyse the following graph. The data shows

Q18: What graphical illustration might you use to

Q18: Calculate the mean and standard deviation of

Q19: Having run a simple contrast with the

Q21: Which contrast would be most appropriate if

Q24: What is the purpose of using an

Examlex

ExamLex

About UsContact UsPerks CenterHomeschoolingTest Prep

Work With Us

Campus RepresentativeInfluencers

Links

FaqPricingChrome Extension

Download The App

Get App StoreGet Google Play

Policies

Privacy PolicyTerms of ServiceHonor CodeCommunity Guidelines

Scan To Download

qr-code

Copyright © (2025) ExamLex LLC.

Privacy PolicyTerms Of ServiceHonor CodeCommunity Guidelines