Multiple Choice
Analyse the following graph. The data shows the results of three groups of 15 athletes who were instructed to complete a basketball shooting exercise (success rate from 20 free throw shots) having received one of three methods of instruction, auditory (shooting technique being verbally described by a coach) , visual (shooting technique being verbally described by a coach) or kinaesthetic (no coaching, just asked to perform the shooting exercise) . Motivation acted as the covariate of interest. How would you describe the regression slopes? 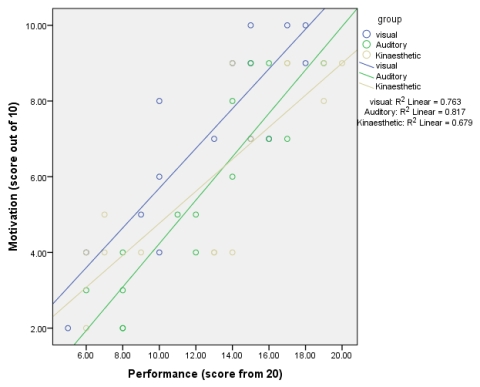
A) Positive and homogeneous
B) Positive and heterogeneous
C) Negative and homogeneous
D) Negative and heterogeneous
Correct Answer:

Verified
Correct Answer:
Verified
Q6: How is eta squared calculated?<br>A) SS<sub>M</sub> /
Q8: Examine the table below. Based on the
Q11: How would you express the results of
Q12: When conducting an ANCOVA, which would be
Q15: Examine the table in Q21 again and
Q15: Analyse the following illustration. Which scenario is
Q18: What graphical illustration might you use to
Q18: Calculate the mean and standard deviation of
Q21: Which contrast would be most appropriate if
Q24: What is the purpose of using an