Multiple Choice
Examine the table below. Based on the answer in Q20, calculate the partial eta squared for motivation. 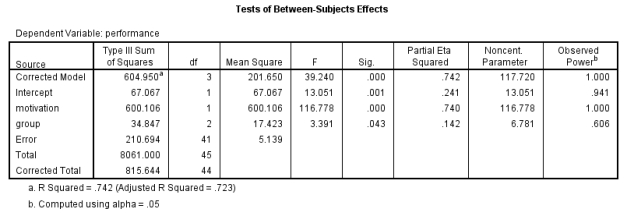
A) .14
B) .74
C) .24
D) .44
Correct Answer:

Verified
Correct Answer:
Verified
Related Questions
Q6: Analyse the following data. What is the
Q10: Which of the following statements best describes
Q11: Based on the result in Q11, which
Q11: How would you express the results of
Q12: When conducting an ANCOVA, which would be
Q13: Analyse the following graph. The data shows
Q14: Run an ANCOVA on the data. What
Q15: Examine the table in Q21 again and
Q16: Because the research design is slightly more
Q18: What graphical illustration might you use to