Multiple Choice
Based on the chart,what was the interquartile range of marks (approximately) . 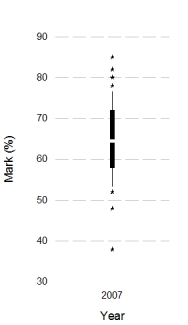
A) 7%
B) 22%
C) 47%
D) 14%
Correct Answer:

Verified
Correct Answer:
Verified
Related Questions
Q1: Imagine we took a group of smokers,
Q13: A study was done to investigate the
Q14: Based on the chart,what was the median
Q16: What is the graph below known as?
Q17: In IBM SPSS,the following graph is known
Q18: Looking at the graph below,which intervention was
Q19: Which of the following statements best describes
Q20: Imagine we took a group of smokers,
Q23: What does a histogram show?<br>A)A histogram is
Q23: What is the graph below known as?