Multiple Choice
Which of the following statements best describes the graph below? 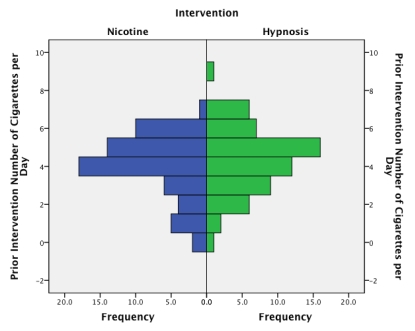
A) The graph shows that for those who used nicotine patches there is a fairly normal distribution,whereas those who used hypnosis show a skewed distribution,where a very small proportion of people (relative to those using nicotine) smoke more than 2 cigarettes per day.
B) The graph shows that for those who used hypnosis there is a fairly normal distribution,whereas those who used nicotine patches show a skewed distribution,where a very large proportion of people (relative to those using nicotine) smoke less than 4 cigarettes per day.
C) The graph looks fairly unsymmetrical,indicating that the two groups are from different populations.
D) The graph looks fairly symmetrical.This indicates that both groups had a similar spread of scores before the intervention.
Correct Answer:

Verified
Correct Answer:
Verified
Q1: Imagine we took a group of smokers,
Q13: A study was done to investigate the
Q14: Based on the chart,what was the median
Q16: What is the graph below known as?
Q17: In IBM SPSS,the following graph is known
Q18: Looking at the graph below,which intervention was
Q20: Based on the chart,what was the interquartile
Q20: Imagine we took a group of smokers,
Q23: What does a histogram show?<br>A)A histogram is
Q23: What is the graph below known as?