Multiple Choice
The following scatterplot represents the results of a study undertaken by Chakrabarty et al. (2005) who were investigating glutamate levels in psychotropic drug-naive OCD patients and comparing them with psychiatrically normal controls. Findings were reported as follows for CSF glutamate levels in OCD patients compared to controls: F(1,29) =11.153, p = 0.002. How would these findings be interpreted? 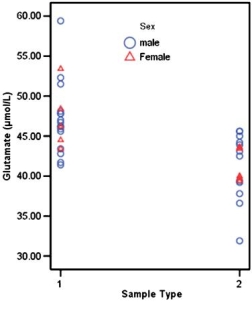 Scatterplot showing CSF glutamate levels in patients (1) and controls (2) . Source: http:/ / www.nature.com/ npp/ journal/ v30/ n9/ full/ 1300733a.html
A) CSF glutamate levels are not significantly raised in OCD patients compared to normal controls.
B) CSF glutamate levels are significantly raised in OCD patients compared to normal controls.
C) CSF glutamate levels are unchanged in OCD patients compared to normal controls.
D) None of the above.
Correct Answer:

Verified
Correct Answer:
Verified
Q1: Which of the following is not considered
Q2: A music teacher had noticed that some
Q5: Using the SPSS output below, which of
Q8: A scatterplot and a summary table for
Q10: A music teacher had noticed that some
Q15: What is an alternative way to model
Q19: Adjusted group means are<br>A) Means across all
Q20: What does the effect size measure in
Q21: In an experiment to study the effectiveness
Q25: Under what circumstances would you not consider