Multiple Choice
Looking at the distribution of data on the bar chart below, how best can it be described? 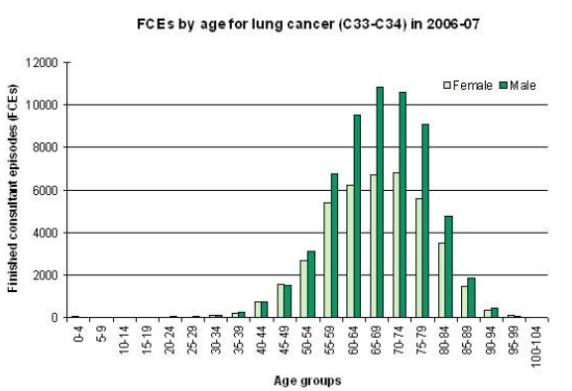
Source: http:/ / www.hesonline.nhs.uk/ Ease/ servlet/ ContentServer?siteID=1937&categoryID=955
A) Normally distributed
B) Negatively skewed
C) Positively skewed
D) Leptokurtic
Correct Answer:

Verified
Correct Answer:
Verified
Related Questions