Multiple Choice
The following figure illustrates the action of a HF and F- buffer where the sizes of the boxes are proportional to the concentrations of HF and F- in solution.According to this figure, what happens when H3O+ is added to the HF/F- buffer? 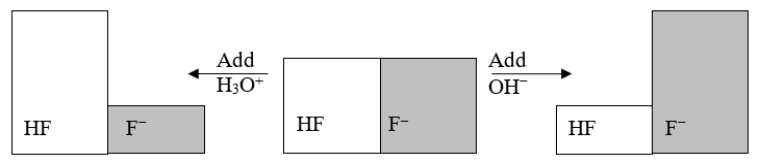
A) The pH decreases.
B) The pH increases.
C) The concentration of HF increases.
D) The concentration of F- increases.
E) Nothing happens.
Correct Answer:

Verified
Correct Answer:
Verified
Q28: Which statement BEST describes the role of
Q29: Each circle is a sample of an
Q30: Each circle is a sample of an
Q31: What is the [OH<sup>-</sup>] in a solution
Q32: When an acid is dissolved in water,
Q34: The following figure illustrates the action of
Q35: A sample of gastric juice has a
Q36: Which statement BEST describes the following reaction?
Q37: All acid-base reactions that we consider in
Q38: Which of the following are conjugate acid-base