Multiple Choice
The following figure illustrates the action of a HF and F- buffer where the sizes of the boxes are proportional to the concentrations of HF and F- in solution.If you add hydronium until all of the F- is converted into HF and then add a little more hydronium, what is observed? 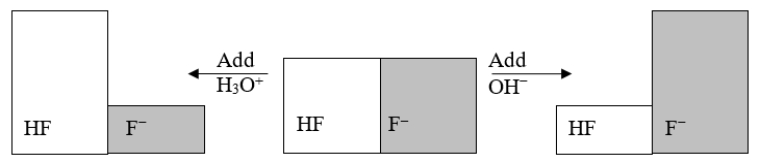
A) The pH increases.
B) The pH decreases.
C) The pH stays the same.
D) The solution will be neutralized.
E) The pH changes, but it is not possible to determine how it will change.
Correct Answer:

Verified
Correct Answer:
Verified
Q29: Each circle is a sample of an
Q30: Each circle is a sample of an
Q31: What is the [OH<sup>-</sup>] in a solution
Q32: When an acid is dissolved in water,
Q33: The following figure illustrates the action of
Q35: A sample of gastric juice has a
Q36: Which statement BEST describes the following reaction?
Q37: All acid-base reactions that we consider in
Q38: Which of the following are conjugate acid-base
Q39: A hydrogen atom without an electron is