Multiple Choice
Figure 15-3 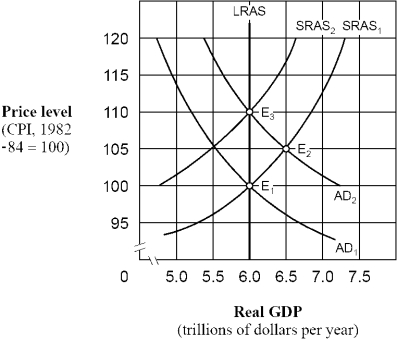
-As shown in Figure 15-3, if people behave according to adaptive expectations theory, an increase in the aggregate demand curve from AD1 to AD2 will cause the economy to move
A) directly from E1 to E3 and then remain at E3.
B) directly from E1 to E2 and then remain at E2.
C) from E1 to E2 initially and then eventually move back to E1.
D) from E1 to E2 initially and then eventually move to E3.
Correct Answer:

Verified
Correct Answer:
Verified
Q11: According to the modern view of the
Q73: Which of the following is an area
Q86: Figure 15-3 <img src="https://d2lvgg3v3hfg70.cloudfront.net/TB7347/.jpg" alt="Figure 15-3
Q93: The U.S. experience during the 1980s and
Q94: Compared to the severe recession of 1981-1982,
Q101: Explain the three lags that make it
Q102: According to the adaptive expectations hypothesis,<br>A) inflation
Q116: Under the rational expectations hypothesis, which of
Q123: Which of the following reduced the effectiveness
Q145: In terms of the Phillips curve, the