Multiple Choice
Figure 15-3 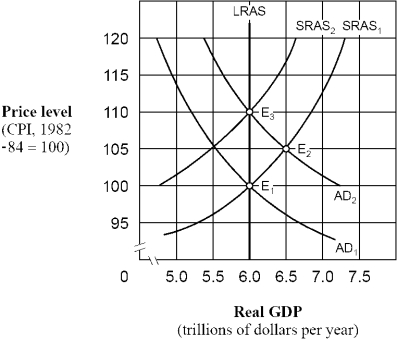
-As shown in Figure 15-3, if people behave according to adaptive expectations theory, an increase in the aggregate demand curve from AD1 to AD2 will cause
A) labor to adjust nominal wages sluggishly.
B) the aggregate supply curve to shift from SRAS1 to SRAS2
C) the price level to eventually rise from 100 to 110.
D) All of the above.
Correct Answer:

Verified
Correct Answer:
Verified
Q11: According to the modern view of the
Q29: Since the 1960s, macroeconomists have become more
Q91: Figure 15-3 <img src="https://d2lvgg3v3hfg70.cloudfront.net/TB7347/.jpg" alt="Figure 15-3
Q101: Explain the three lags that make it
Q102: According to the adaptive expectations hypothesis,<br>A) inflation
Q107: If the index of leading indicators and
Q118: Computer forecasting models have<br>A) been able to
Q128: Which of the following contributed to the
Q145: In terms of the Phillips curve, the
Q152: Under the adaptive expectations theory, expansionary monetary