Multiple Choice
Figure 15-3 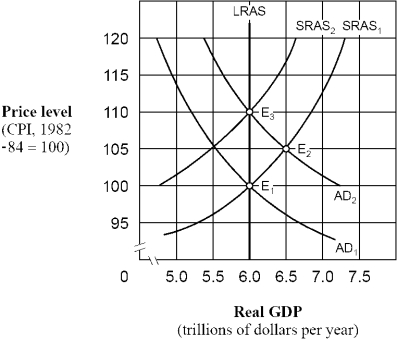
-As shown in Figure 15-3, if people behave according to rational expectations theory, an increase in the aggregate demand curve from AD1 to AD2 will cause the price level to move
A) directly from 100 to 105 and then remain at 105.
B) directly from 100 to 110 and then remain at 110.
C) from 100 to 105 initially and then eventually move back to 100.
D) from 100 to 105 initially and then eventually move to 110.
Correct Answer:

Verified
Correct Answer:
Verified
Q26: Under the adaptive expectations hypothesis, which of
Q53: According to the theory of rational expectations,
Q58: The rational expectations hypothesis indicates that people<br>A)
Q60: If indicators like weak demand and falling
Q70: If the government accelerates money supply growth
Q133: When it comes to macro-policy, most economists
Q140: Most economists agree that<br>A) fiscal policy is
Q142: Under the adaptive expectations theory, people persistently<br>A)
Q143: The main policy conclusion of the rational
Q146: Figure 15-3 <img src="https://d2lvgg3v3hfg70.cloudfront.net/TB7347/.jpg" alt="Figure 15-3