Multiple Choice
Use the figure below to answer the following question(s) .
Figure 10-15 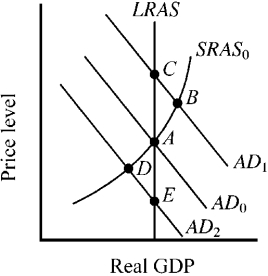
-The economy's short-run (SRAS ) and long-run (LRAS) aggregate supply curves are shown in Figure 10-15, along with three alternative aggregate demand curves and the accompanying equilibrium points. At which point will resource prices naturally tend to increase?
A) A
B) B
C) C
D) D
Correct Answer:

Verified
Correct Answer:
Verified
Q49: The short-run effect of a sudden increase
Q72: The expected price level is important because<br>A)
Q87: If an improvement in the quality of
Q153: Figure 10-18 <img src="https://d2lvgg3v3hfg70.cloudfront.net/TB7347/.jpg" alt="Figure 10-18
Q154: Use the figure below to answer the
Q155: Use the figure below to answer the
Q156: Starting from long-run equilibrium at point A,
Q164: Other things constant, a reduction in the
Q183: An increase in the consumer sentiment index
Q190: Within the AD/AS model, an unanticipated increase