Multiple Choice
Figure 10-18 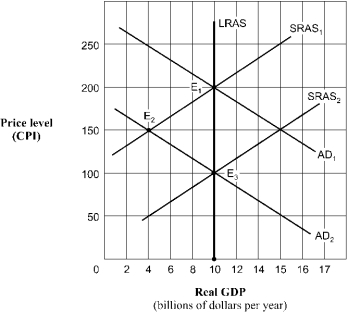
-Beginning in Figure 10-18 from long-run equilibrium at point E1, the aggregate demand curve shifts to AD2. The economy's path to a new long-run equilibrium is represented by a movement from
A) E3 to E1 to E2.
B) E1 to E3 to E2.
C) E2 to E1 to E2.
D) E1 to E2 to E3.
Correct Answer:

Verified
Correct Answer:
Verified
Related Questions
Q49: The short-run effect of a sudden increase
Q84: If the U.S. price level increased relative
Q87: If an improvement in the quality of
Q151: Use the figure below to answer the
Q154: Use the figure below to answer the
Q155: Use the figure below to answer the
Q156: Starting from long-run equilibrium at point A,
Q158: Use the figure below to answer the
Q164: Other things constant, a reduction in the
Q190: Within the AD/AS model, an unanticipated increase