Multiple Choice
The graph in the figure shows the variation of the electric potential V(x) (in arbitrary units) as a function of the position x (also in arbitrary units) . Which of the choices below correctly describes the orientation of the x-component of the electric field along the x-axis? 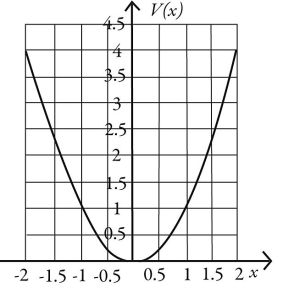
A) Ex is positive from x = -2 to x = 2.
B) Ex is positive from x = -2 to x = 0, and negative from x = 0 to x = 2.
C) Ex is negative from x = -2 to x = 0, and positive from x = 0 to x = 2.
D) Ex is negative from x = -2 to x = 2.
Correct Answer:

Verified
Correct Answer:
Verified
Q4: Equal but opposite charges Q are placed
Q4: The capacitive network shown in the figure
Q6: The capacitive network shown in the figure
Q8: Three capacitors, with capacitances <img src="https://d2lvgg3v3hfg70.cloudfront.net/TB7476/.jpg" alt="Three
Q11: The graph in the figure shows the
Q18: A parallel-plate capacitor has plates of area
Q27: Three capacitors,of capacitance 5.00 μF,10.0 μF,and 50.0
Q37: Two capacitors,C<sub>1</sub> and C<sub>2</sub>,are connected in series
Q40: A conducting sphere contains positive charge distributed
Q42: A 6.0-μF air-filled capacitor is connected across