Multiple Choice
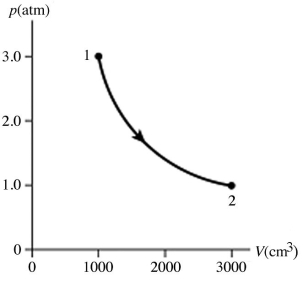
The figure shows a pV diagram for 0.95 mol of gas that undergoes the process 1 → 2. The gas then undergoes an isochoric heating from point 2 until the pressure is restored to the value it had at point 1. What is the final temperature of the gas? The ideal gas constant is R = 8.314 J/mol ∙ K =  .
. 
A) -160°C
B) 15°C
C) 390°C
D) 120°C
Correct Answer:

Verified
Correct Answer:
Verified
Q8: 1)000 L of water at 20.00°C will
Q11: Which contains more moles of material: 80
Q17: A 3.2-L volume of neon gas (Ne)is
Q19: If a certain sample of an ideal
Q24: A brass rod is 40.1 cm long
Q28: The number of molecules in one mole
Q37: A sealed container holds 0.020 moles of
Q43: 3.00 moles of an ideal gas at
Q44: The exterior of a supersonic airplane is
Q53: When a solid melts,<br>A) the temperature of