Short Answer
The graph in the figure shows the position of an object as a function of time. The letters H-L represent particular moments of time. At which moments shown (H, I, etc.) is the speed of the object
(a) the greatest?
(b) the smallest? 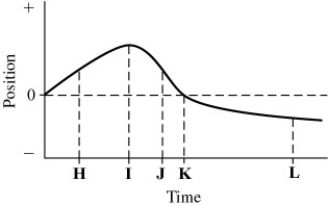
Correct Answer:

Verified
Correct Answer:
Verified
Related Questions
Q5: A rocket takes off vertically from the
Q7: An object starts its motion with a
Q8: The figure shows the position of an
Q9: Two identical objects A and B fall
Q11: If the acceleration of an object is
Q17: If the graph of the position as
Q27: A test rocket is fired straight up
Q31: Suppose that an object is moving with
Q34: A rock is dropped from the top
Q54: A car is 200 m from a