Multiple Choice
An object starts its motion with a constant velocity of 2.0 m/s toward the east. After 3.0 s, the object stops for 1.0 s. The object then moves toward the west a distance of 2.0 m in 3.0 s. The object continues traveling in the same direction, but increases its speed by 1.0 m/s for the next 2.0 s. Which graph below could represent the motion of this object?
A) 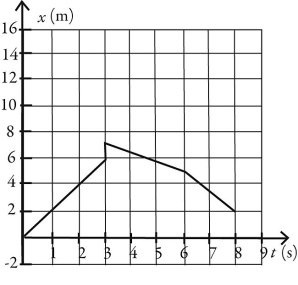
B) 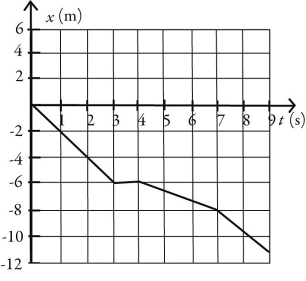
C) 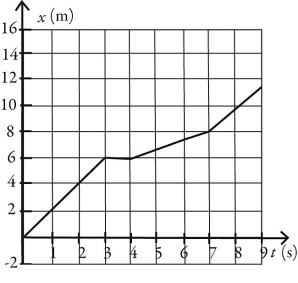
D) 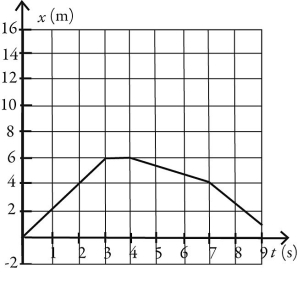
Correct Answer:

Verified
Correct Answer:
Verified
Q3: A ball is projected upward at time
Q4: A racing car accelerates uniformly from rest
Q8: The figure shows the position of an
Q9: Two identical objects A and B fall
Q11: If the acceleration of an object is
Q12: The graph in the figure shows the
Q33: A ball is thrown directly upward and
Q51: A car starts from rest and accelerates
Q54: A car is 200 m from a
Q59: A foul ball is hit straight up