Multiple Choice
The figure shows the graph of the position x as a function of time for an object moving in the straight line (the x-axis) . Which of the following graphs best describes the velocity along the x-axis as a function of time for this object? 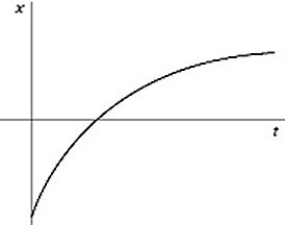
A) 
B) 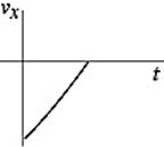
C) 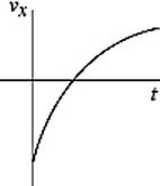
D) 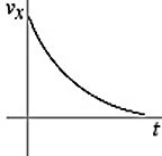
E) 
Correct Answer:

Verified
Correct Answer:
Verified
Related Questions
Q10: Two objects are thrown from the top
Q17: If the graph of the position as
Q20: The acceleration of an object as a
Q23: The position of an object as a
Q24: The figure shows a graph of the
Q25: A ball is projected upward at time
Q26: An airplane that is flying level needs
Q27: The figure represents the position of a
Q47: Suppose that a car traveling to the
Q49: Two objects are dropped from a bridge,an