Short Answer
The figure shows a graph of the velocity as a function of time for a basketball player traveling up and down the court in a straight-line path. For the 10 s shown on the graph, find
(a) the net displacement of the player.
(b) the total distance run by the player. 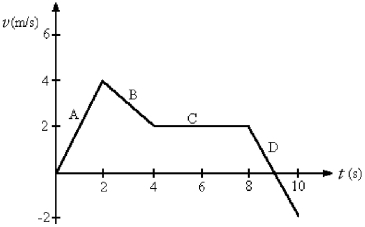
Correct Answer:

Verified
Correct Answer:
Verified
Related Questions
Q10: Two objects are thrown from the top
Q20: The acceleration of an object as a
Q22: The figure shows the graph of the
Q23: The position of an object as a
Q25: A ball is projected upward at time
Q26: An airplane that is flying level needs
Q27: The figure represents the position of a
Q28: The motion of a particle is described
Q29: If the fastest you can safely drive
Q47: Suppose that a car traveling to the