Short Answer
The figure shows the position of an object as a function of time, with all numbers accurate to two significant figures. Between time  and time
  (a) what is the average speed of the object?
(b) what is the average velocity of the object? 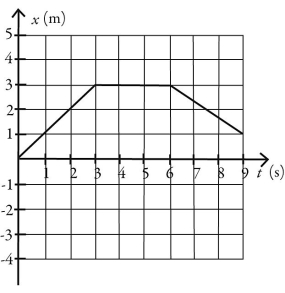
Correct Answer:

Verified
(a) 0.56 m...View Answer
Unlock this answer now
Get Access to more Verified Answers free of charge
Correct Answer:
Verified
(a) 0.56 m...
View Answer
Unlock this answer now
Get Access to more Verified Answers free of charge
Related Questions
Q13: The acceleration of an object as a
Q15: When can we be certain that the
Q19: A speeding car is traveling at a
Q24: To determine the height of a flagpole,Abby
Q51: The velocity of an object is given
Q52: A dragster starts from rest and travels
Q53: The figure represents the velocity of a
Q54: The position of an object as a
Q55: A package is dropped from a helicopter
Q56: At the same moment from the top