Multiple Choice
Figure 26-9 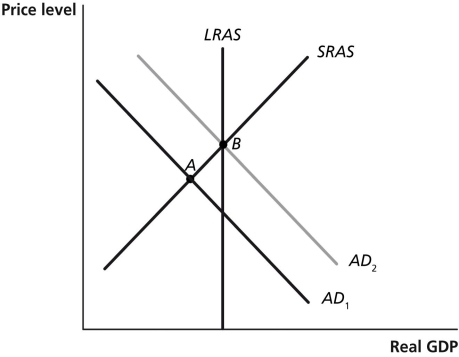
-Refer to Figure 26-9. In the figure above suppose the economy is initially at point A. The movement of the economy to point B as shown in the graph illustrates the effect of which of the following policy actions by the Federal Reserve?
A) a decrease in income taxes
B) an increase in the required reserve ratio
C) an open market purchase of Treasury bills
D) an open market sale of Treasury bills
Correct Answer:

Verified
Correct Answer:
Verified
Q29: Your income will increase if the Federal
Q61: Which of the following would cause the
Q118: Give an example of a monetary policy
Q193: Figure 26-7 <img src="https://d2lvgg3v3hfg70.cloudfront.net/TB7397/.jpg" alt="Figure 26-7
Q194: Figure 26-11 <img src="https://d2lvgg3v3hfg70.cloudfront.net/TB7397/.jpg" alt="Figure 26-11
Q196: By the 2000s,an important market change occurred
Q201: Figure 26-7 <img src="https://d2lvgg3v3hfg70.cloudfront.net/TB7397/.jpg" alt="Figure 26-7
Q203: Figure 26-13 <img src="https://d2lvgg3v3hfg70.cloudfront.net/TB7397/.jpg" alt="Figure 26-13
Q236: What is a mortgage? What were the
Q239: When calculating GDP,the Bureau of Economic Analysis