Multiple Choice
Figure 26-13 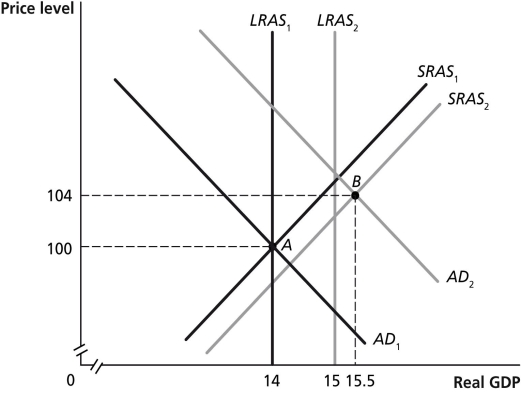
-Refer to Figure 26-13. In the figure above, if the economy in Year 1 is at point A and is expected in Year 2 to be at point B, then the appropriate monetary policy by the Federal Reserve would be to
A) lower interest rates.
B) raise interest rates.
C) lower income taxes.
D) raise income taxes.
Correct Answer:

Verified
Correct Answer:
Verified
Q23: An increase in the money supply will<br>A)increase
Q66: Federal Reserve Board Chairmen Paul Volcker,as well
Q118: Give an example of a monetary policy
Q163: The supporters of a monetary growth rule
Q198: Figure 26-9 <img src="https://d2lvgg3v3hfg70.cloudfront.net/TB7397/.jpg" alt="Figure 26-9
Q201: Figure 26-7 <img src="https://d2lvgg3v3hfg70.cloudfront.net/TB7397/.jpg" alt="Figure 26-7
Q205: Figure 26-12 <img src="https://d2lvgg3v3hfg70.cloudfront.net/TB7397/.jpg" alt="Figure 26-12
Q206: Figure 26-12 <img src="https://d2lvgg3v3hfg70.cloudfront.net/TB7397/.jpg" alt="Figure 26-12
Q236: What is a mortgage? What were the
Q239: When calculating GDP,the Bureau of Economic Analysis