Multiple Choice
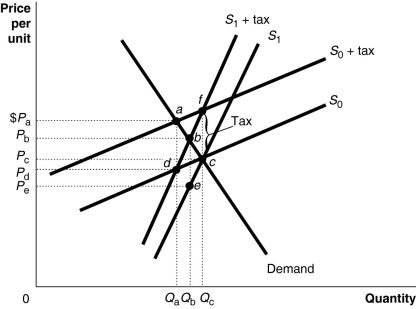
Figure 18-2  Figure 18-2 shows a demand curve and two sets of supply curves, one set more elastic than the other.
-Refer to Figure 18-2. If the government imposes an excise tax of $1.00 on every unit sold, the producer's burden of the tax
A) is greater under the more elastic supply curve S0.
B) is greater under the less elastic supply curve S0.
C) is greater under the less elastic supply curve S1.
D) is the same under either supply curve because there is a single demand curve that captures buyers' market behavior.
Correct Answer:

Verified
Correct Answer:
Verified
Q4: Public schools in the United States get
Q54: Figure 18-1<br> <img src="https://d2lvgg3v3hfg70.cloudfront.net/TB4193/.jpg" alt="Figure 18-1
Q75: Table 18-9<br> <img src="https://d2lvgg3v3hfg70.cloudfront.net/TB4193/.jpg" alt="Table 18-9
Q84: What is the United States government's formal
Q87: Economist Kenneth Arrow has shown mathematically that
Q112: Which of the following statements concerning the
Q146: The public choice model asserts that the
Q150: Consider the following methods of taxing a
Q161: The actual division of a tax between
Q167: The public choice model raises questions about