Multiple Choice
Figure 5-1 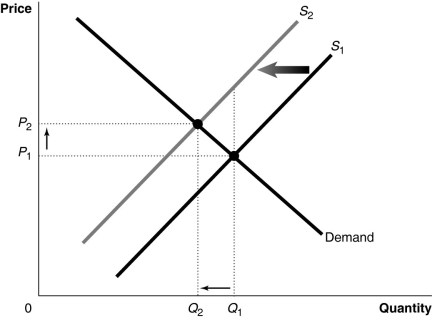 Figure 5-1 shows a market with an externality. The current market equilibrium output of Q1 is not the economically efficient output. The economically efficient output is Q2.
-Refer to Figure 5-1. If, because of an externality, the economically efficient output is Q2 and not the current equilibrium output of Q1, what does S1 represent?
A) the market supply curve reflecting external cost
B) the market supply curve reflecting implicit cost
C) the market supply curve reflecting marginal social cost
D) the market supply curve reflecting marginal private cost
Correct Answer:

Verified
Correct Answer:
Verified
Q97: Which of the following displays these two
Q131: A market demand curve reflects the<br>A)marginal private
Q186: Economic incentives are designed to make individual
Q186: Figure 5-9 <img src="https://d2lvgg3v3hfg70.cloudfront.net/TB7397/.jpg" alt="Figure 5-9
Q187: Figure 5-6 <img src="https://d2lvgg3v3hfg70.cloudfront.net/TB7397/.jpg" alt="Figure 5-6
Q188: Figure 5-5 <img src="https://d2lvgg3v3hfg70.cloudfront.net/TB7397/.jpg" alt="Figure 5-5
Q192: A modern example of the tragedy of
Q194: Figure 5-2 <img src="https://d2lvgg3v3hfg70.cloudfront.net/TB7397/.jpg" alt="Figure 5-2
Q235: Figure 5-8<br> <img src="https://d2lvgg3v3hfg70.cloudfront.net/TB4193/.jpg" alt="Figure 5-8
Q259: Figure 5-7<br> <img src="https://d2lvgg3v3hfg70.cloudfront.net/TB4193/.jpg" alt="Figure 5-7