Multiple Choice
Figure 5-2 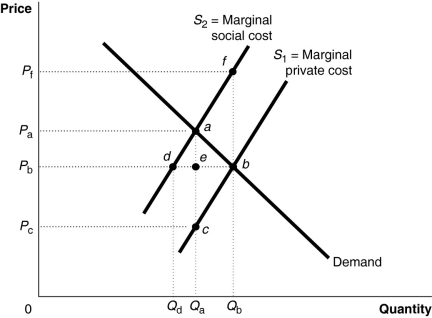 Figure 5-2 shows a market with a negative externality.
-Refer to Figure 5-2. The private profit-maximizing quantity for the firm is
A) Qa.
B) Qb.
C) Qb - Qd.
D) Qd.
Correct Answer:

Verified
Correct Answer:
Verified
Q97: Which of the following displays these two
Q131: A market demand curve reflects the<br>A)marginal private
Q175: Private producers have no incentive to provide
Q186: Economic incentives are designed to make individual
Q191: Figure 5-1 <img src="https://d2lvgg3v3hfg70.cloudfront.net/TB7397/.jpg" alt="Figure 5-1
Q192: A modern example of the tragedy of
Q207: Private costs<br>A)are borne by producers of a
Q221: Global warming refers to the effect of
Q235: Figure 5-8<br> <img src="https://d2lvgg3v3hfg70.cloudfront.net/TB4193/.jpg" alt="Figure 5-8
Q259: Figure 5-7<br> <img src="https://d2lvgg3v3hfg70.cloudfront.net/TB4193/.jpg" alt="Figure 5-7