Multiple Choice
Figure 5-1 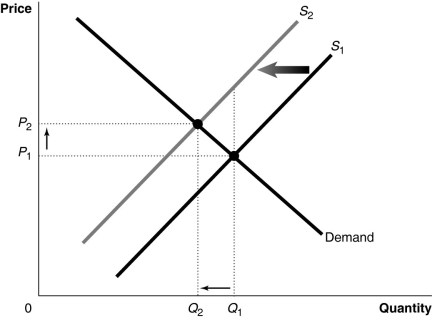 Figure 5-1 shows a market with an externality. The current market equilibrium output of Q1 is not the economically efficient output. The economically efficient output is Q2.
-Refer to Figure 5-1. If, because of an externality, the economically efficient output is Q2 and not the current equilibrium output of Q1, what does S2 represent?
A) the market supply curve reflecting marginal private cost
B) the market supply curve reflecting marginal social cost
C) the market supply curve reflecting external cost
D) the market supply curve reflecting implicit cost
Correct Answer:

Verified
Correct Answer:
Verified
Q27: Which of the following is an example
Q40: When there is a positive externality,<br>A)the marginal
Q50: Congress passed the Clean Air Act in
Q51: Who was the economist who first proposed
Q57: Figure 5-16<br> <img src="https://d2lvgg3v3hfg70.cloudfront.net/TB4193/.jpg" alt="Figure 5-16
Q113: When production generates a negative externality, the
Q118: The efficient output level of a public
Q143: In economics, the optimal level of pollution
Q205: For certain public projects such as building
Q216: Figure 5-7 <img src="https://d2lvgg3v3hfg70.cloudfront.net/TB7397/.jpg" alt="Figure 5-7