Essay
The graph below represents the market for lychee nuts. The equilibrium price is $7.00 per bushel, but the market price is $5.00 per bushel. Identify the areas representing consumer surplus, producer surplus, and deadweight loss at the equilibrium price of $7.00 and at the market price of $5.00. 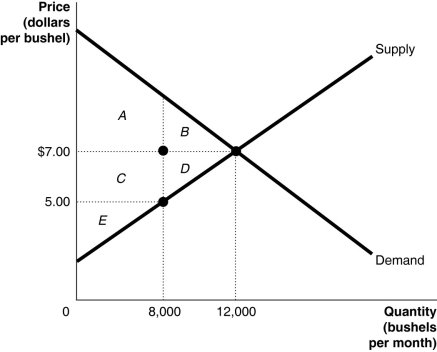
Correct Answer:

Verified
At the equilibrium price of $7.00:
Consu...View Answer
Unlock this answer now
Get Access to more Verified Answers free of charge
Correct Answer:
Verified
Consu...
View Answer
Unlock this answer now
Get Access to more Verified Answers free of charge
Q96: If the quantity of tacos demanded is
Q104: The additional cost to a firm of
Q108: Consumer surplus is the difference between the
Q311: Figure 4-11 <img src="https://d2lvgg3v3hfg70.cloudfront.net/TB7397/.jpg" alt="Figure 4-11
Q312: Figure 4-10 <img src="https://d2lvgg3v3hfg70.cloudfront.net/TB7397/.jpg" alt="Figure 4-10
Q314: Table 4-7<br> <img src="https://d2lvgg3v3hfg70.cloudfront.net/TB7397/.jpg" alt="Table 4-7
Q315: Figure 4-15 <img src="https://d2lvgg3v3hfg70.cloudfront.net/TB7397/.jpg" alt="Figure 4-15
Q317: Figure 4-18 <img src="https://d2lvgg3v3hfg70.cloudfront.net/TB7397/.jpg" alt="Figure 4-18
Q318: Figure 4-11 <img src="https://d2lvgg3v3hfg70.cloudfront.net/TB7397/.jpg" alt="Figure 4-11
Q321: Figure 4-8 <img src="https://d2lvgg3v3hfg70.cloudfront.net/TB7397/.jpg" alt="Figure 4-8