Multiple Choice
Table 4-7
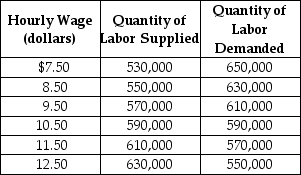 Table 4-7 shows the demand and supply schedules for the labor market in the city of Pixley.
-Refer to Table 4-7. What is the equilibrium hourly wage (W*) and the equilibrium quantity of labor (Q*) ?
A) W* = $10.50; Q* = 590,000
B) W* = $11.50; Q* = 570,000
C) W* = $9.50; Q* = 570,000
D) W* = $10.50; Q* = 1,180,000
Correct Answer:

Verified
Correct Answer:
Verified
Q33: Figure 4-2 <img src="https://d2lvgg3v3hfg70.cloudfront.net/TB1236/.jpg" alt="Figure 4-2
Q96: If the quantity of tacos demanded is
Q108: Consumer surplus is the difference between the
Q309: Figure 4-18 <img src="https://d2lvgg3v3hfg70.cloudfront.net/TB7397/.jpg" alt="Figure 4-18
Q311: Figure 4-11 <img src="https://d2lvgg3v3hfg70.cloudfront.net/TB7397/.jpg" alt="Figure 4-11
Q312: Figure 4-10 <img src="https://d2lvgg3v3hfg70.cloudfront.net/TB7397/.jpg" alt="Figure 4-10
Q315: Figure 4-15 <img src="https://d2lvgg3v3hfg70.cloudfront.net/TB7397/.jpg" alt="Figure 4-15
Q316: The graph below represents the market for
Q317: Figure 4-18 <img src="https://d2lvgg3v3hfg70.cloudfront.net/TB7397/.jpg" alt="Figure 4-18
Q318: Figure 4-11 <img src="https://d2lvgg3v3hfg70.cloudfront.net/TB7397/.jpg" alt="Figure 4-11