Essay
Table 3-5
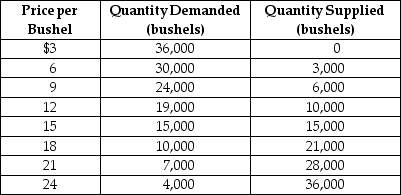
-Refer to Table 3-5. The table contains information about the corn market. Use the table to answer the following questions.
a. What are the equilibrium price and quantity of corn?
b. Suppose the prevailing price is $9 per bushel. Is there a shortage or a surplus in the market?
c. What is the quantity of the shortage or surplus?
d. How many bushels will be sold if the market price is $9 per bushel?
e. If the market price is $9 per bushel, what must happen to restore equilibrium in the market?
f. At what price will suppliers be able to sell 24,000 bushels of corn?
g. Suppose the market price is $21 per bushel. Is there a shortage or a surplus in the market?
h. What is the quantity of the shortage or surplus?
i. How many bushels will be sold if the market price is $21 per bushel?
j. If the market price is $21 per bushel, what must happen to restore equilibrium in the market?
Correct Answer:

Verified
a. Equilibrium price = $15; Equilibrium ...View Answer
Unlock this answer now
Get Access to more Verified Answers free of charge
Correct Answer:
Verified
View Answer
Unlock this answer now
Get Access to more Verified Answers free of charge
Q2: Figure 3-4 <img src="https://d2lvgg3v3hfg70.cloudfront.net/TB1236/.jpg" alt="Figure 3-4
Q8: Figure 3-4<br> <img src="https://d2lvgg3v3hfg70.cloudfront.net/TB4193/.jpg" alt="Figure 3-4
Q37: Which of the following will not shift
Q74: If the demand for a product decreases
Q133: An inferior good is a good for
Q158: In July,market analysts predict that the price
Q162: A firm has an incentive to decrease
Q184: During the 1990s positive technological change in
Q231: Figure 3-8 <img src="https://d2lvgg3v3hfg70.cloudfront.net/TB1236/.jpg" alt="Figure 3-8
Q233: Figure 3-7<br> <img src="https://d2lvgg3v3hfg70.cloudfront.net/TB4193/.jpg" alt="Figure 3-7