Multiple Choice
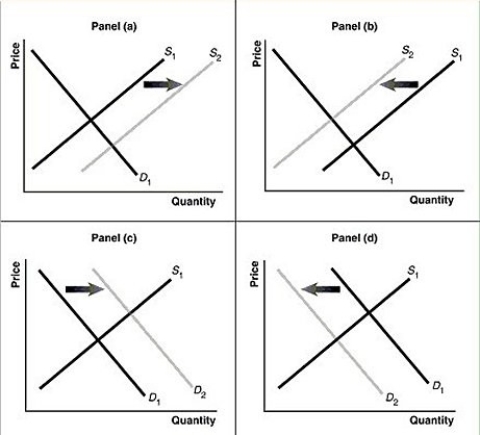
Figure 3-7

-Refer to Figure 3-7.Assume that the graphs in this figure represent the demand and supply curves for almonds.Which panel best describes what happens in this market when there is an increase in the productivity of almond harvesters?
A) Panel (a)
B) Panel (b)
C) Panel (c)
D) Panel (d)
Correct Answer:

Verified
Correct Answer:
Verified
Q228: Figure 3-1<br> <img src="https://d2lvgg3v3hfg70.cloudfront.net/TB4193/.jpg" alt="Figure 3-1
Q229: A normal good is a good for
Q230: In 2004, hurricanes destroyed a large portion
Q231: A positive technological change will cause the
Q232: Figure 3-7<br> <img src="https://d2lvgg3v3hfg70.cloudfront.net/TB4193/.jpg" alt="Figure 3-7
Q234: Which of the following has occurred as
Q235: Which of the following is evidence of
Q236: An article in the Wall Street Journal
Q237: What is the law of supply? What
Q238: Which of the following statements is true?<br>A)An